Atlanta Crime Analysis
This project focuses on performing geospatial analysis of the Atlanta Police Department's crime data spanning from 2009 to 2020. Through data visualization, exploration, and interpretation, we aim to gain insights into crime trends, hotspots, and patterns within the city of Atlanta. An interactive crime density map was created with data from 2016-2022 at the end of the project.
Introduction
Crime analysis is a crucial aspect of maintaining public safety. This project seeks to leverage geospatial analysis techniques to provide a better understanding of crime occurrences in Atlanta. By visualizing the data on maps and charts, we aim to uncover meaningful patterns that could aid law enforcement agencies, policymakers, and the community in making informed decisions.
Motivation
This project was an exciting chance for me to blend my passion for crime narratives with data analysis. Combining Python and geospatial techniques, I stepped into the shoes of movie detectives, decoding enigmatic crime data patterns. The process mirrored cinematic thrillers, uncovering insights akin to 'Eureka!' moments. This project let me live out screen-worthy crime-solving adventures, from unraveling webs of criminal activities to mapping hotspots. Merging my movie love with data science created a captivating experience, weaving exploration and discovery into a rewarding endeavor.
Data
The primary dataset used in this project is the Atlanta Police Department's crime data. This dataset contains records of various types of crimes, their locations, dates, and other relevant information. The dataset covers a span of over a decade, allowing us to identify trends and patterns that have emerged over the years.
The dataset can be downloaded at Atlanta PD
Analysis
Our analysis involves various stages, including:
1. Data Preprocessing: Cleaning, transforming, and organizing the raw data into a suitable format for analysis.
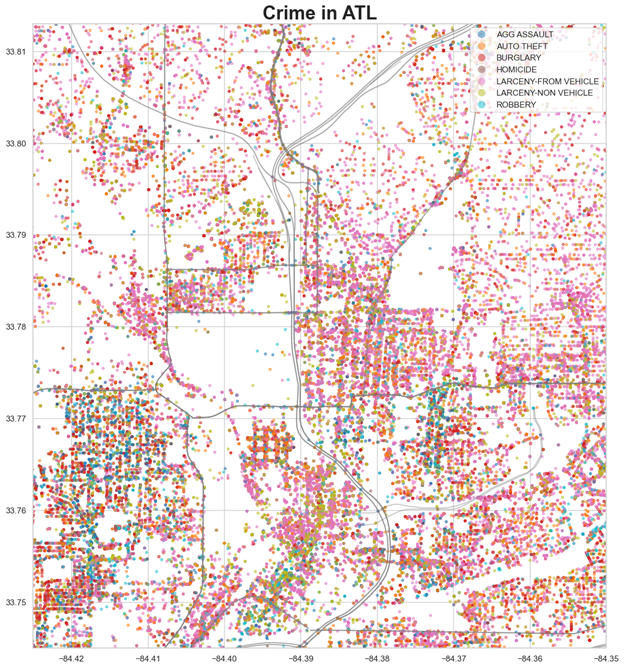
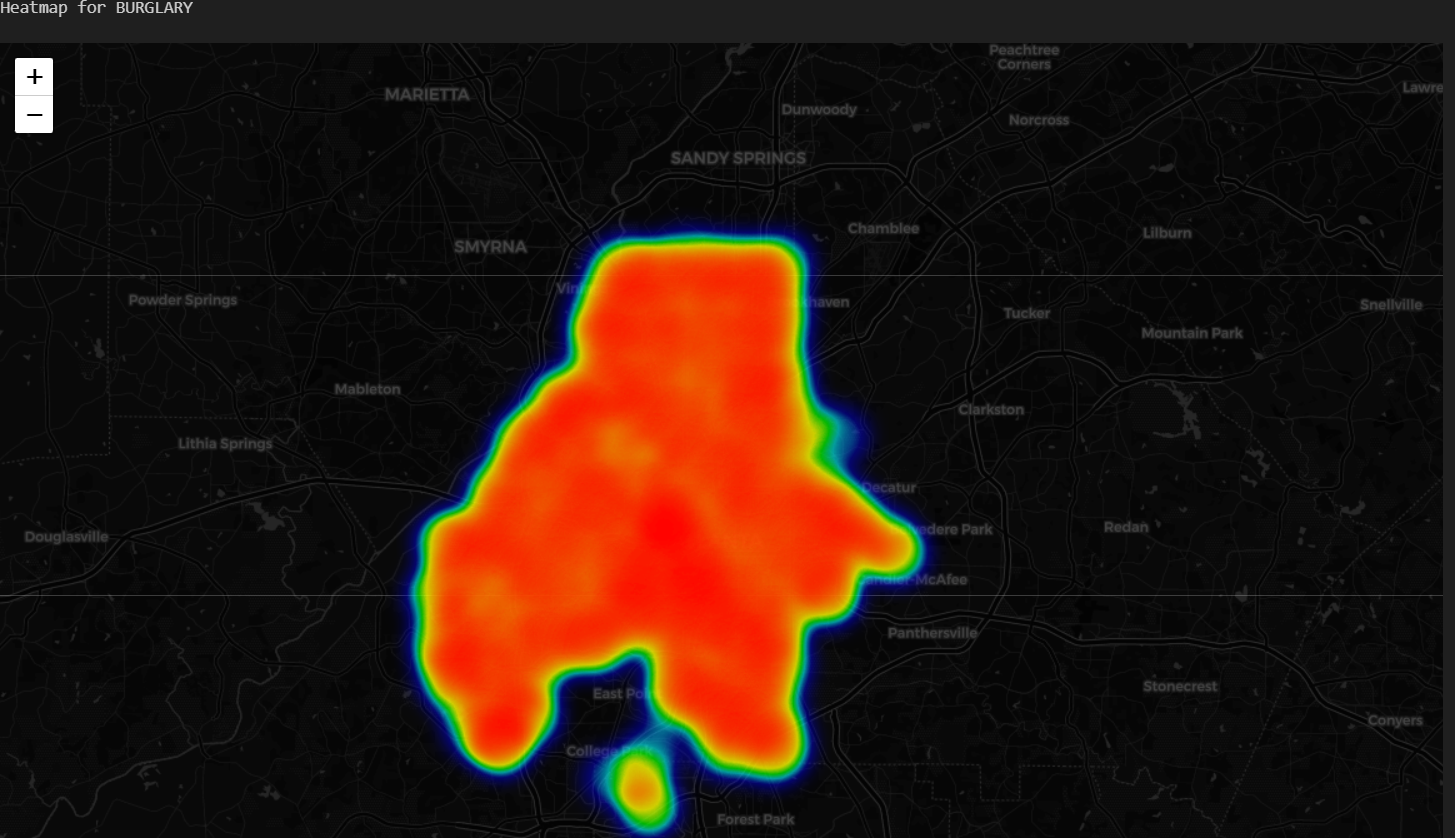
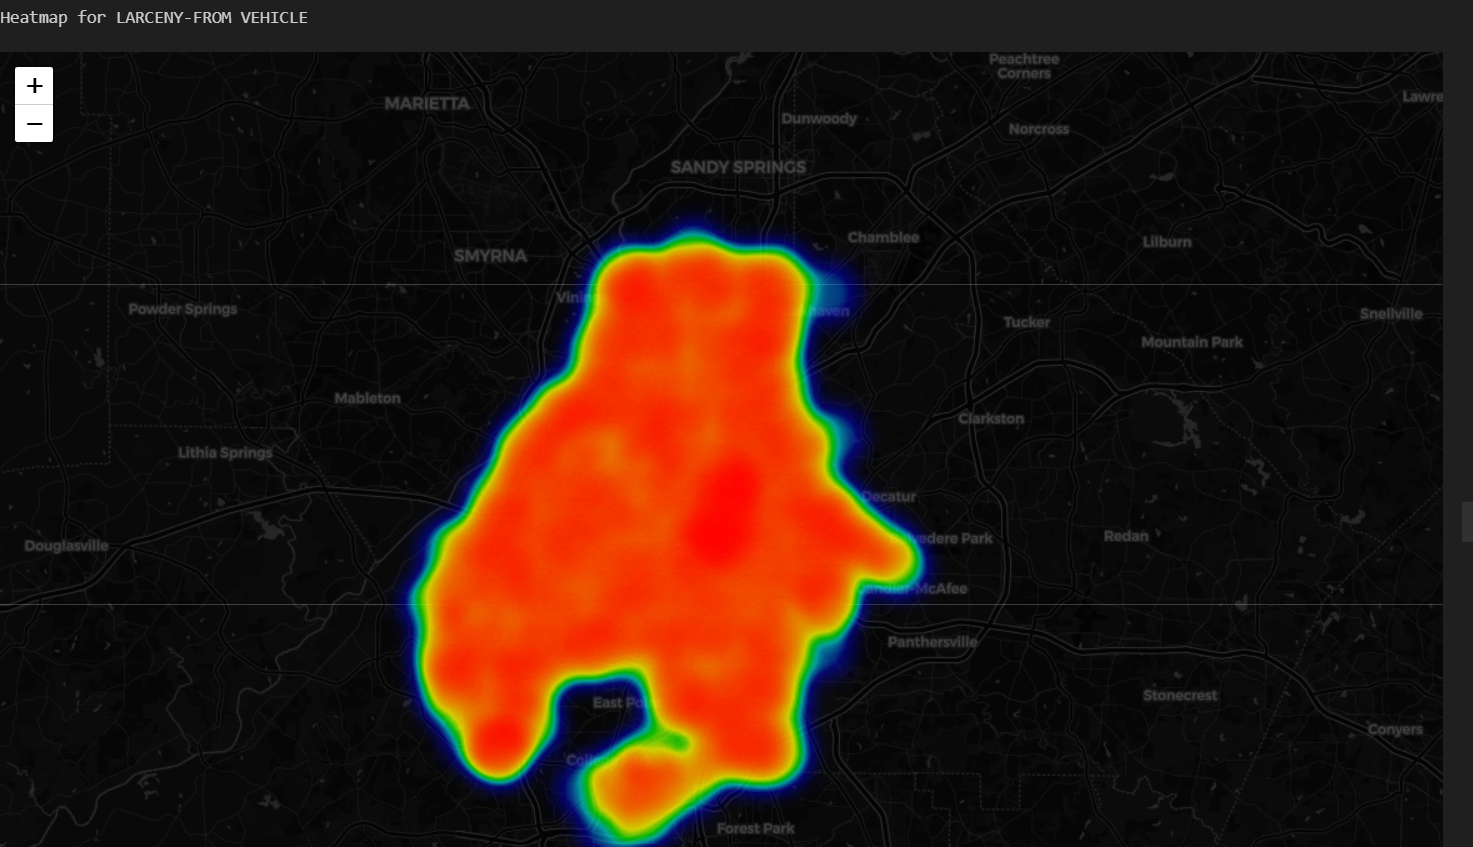
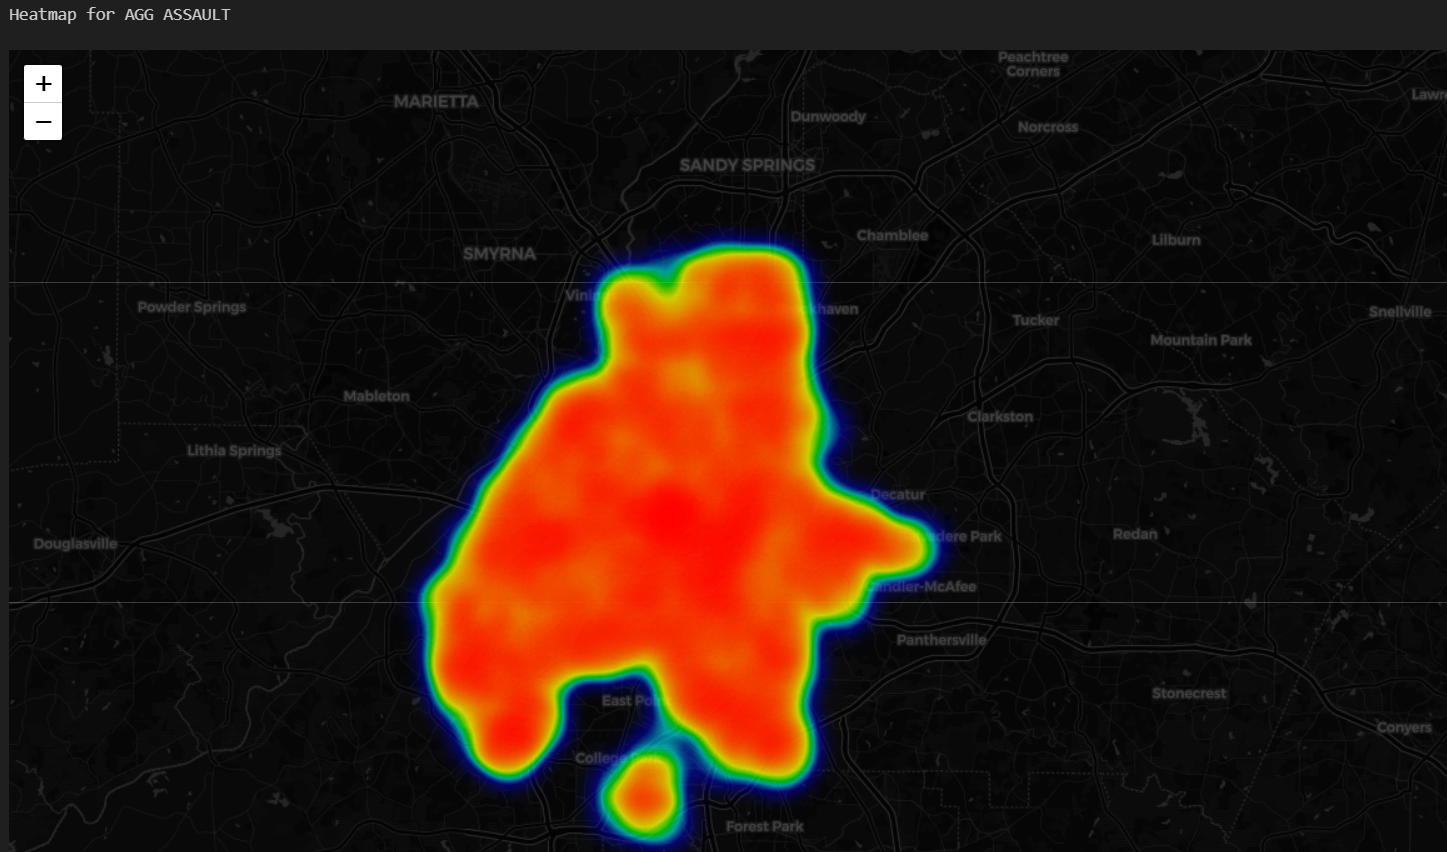
2. Geospatial Visualization: Plotting crime incidents on maps to identify crime hotspots, trends, and areas of concern.
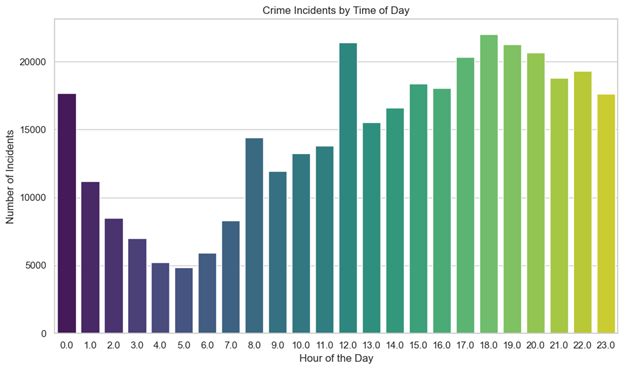
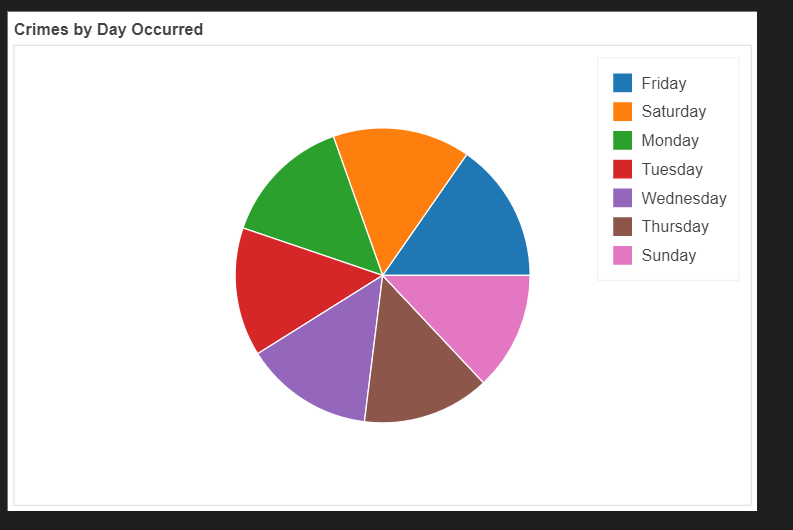
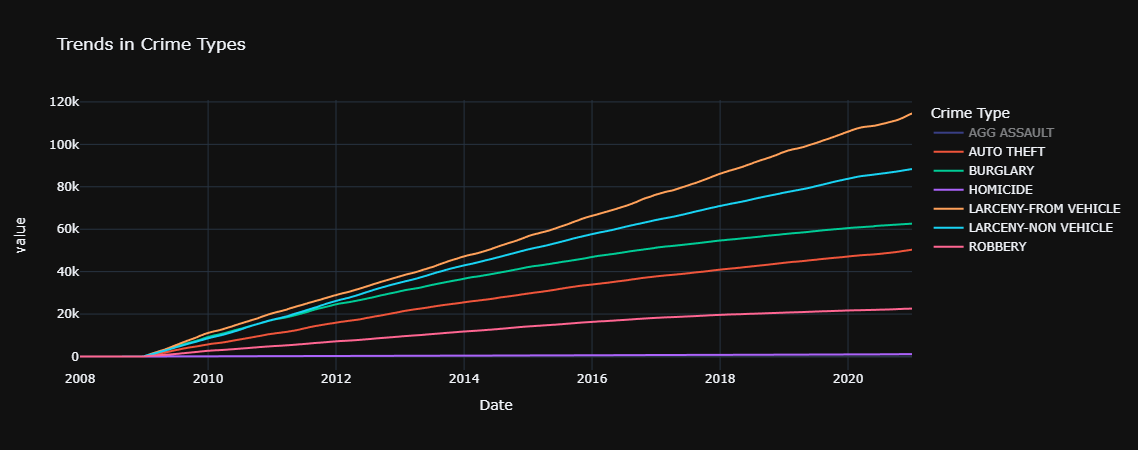
3. Temporal Analysis: Studying how crime rates vary across different time periods, such as months, days of the week, and hours of the day Time series.
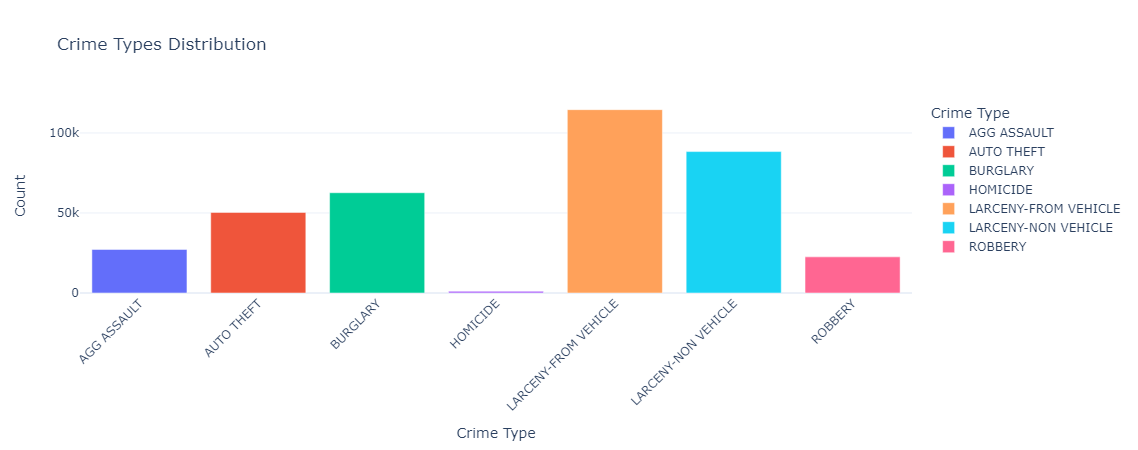
4. Crime Types: Exploring the distribution of different crime types to identify prevalent and emerging criminal activities.
Usage
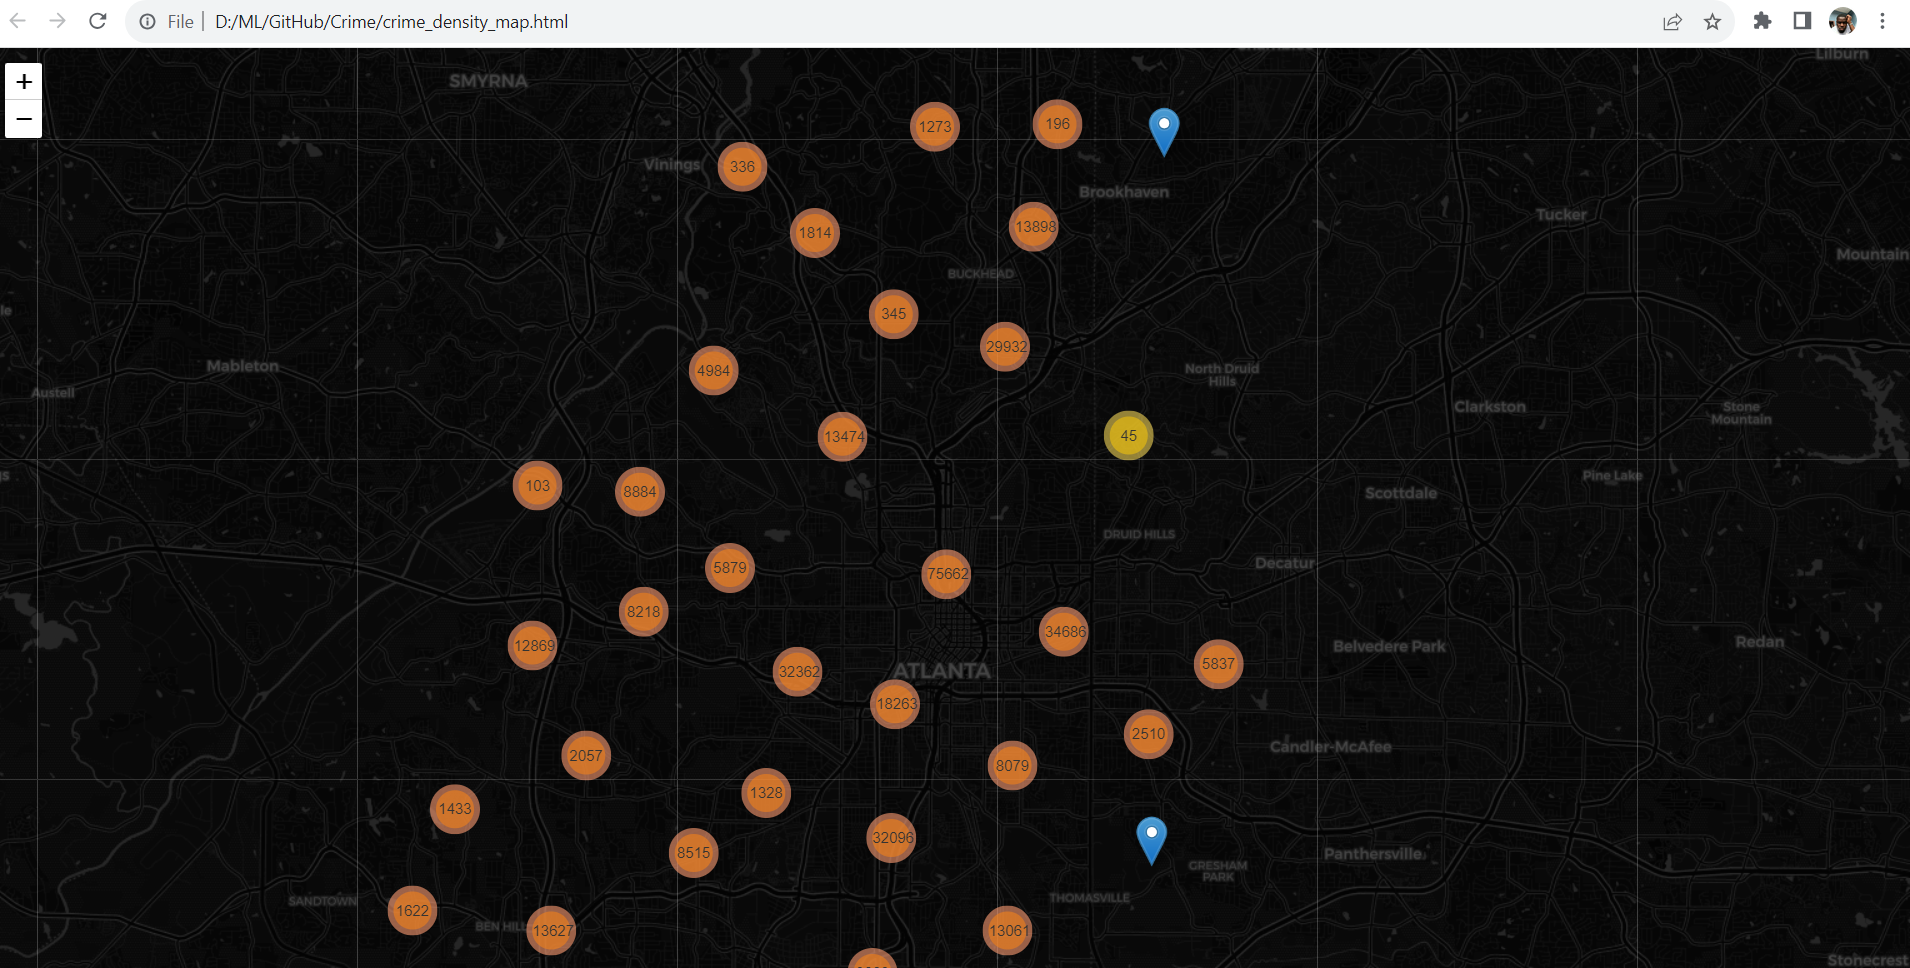
The final product of this project is an interactive density map that highlights crime hotspots within the city of Atlanta. You can find the link to the web map below:
[Click here to use the Interactive Density Map]
To explore the analysis and findings of this project, you can:
Visit this GitHub repository